
Lifetime Value Modeling (LTV Modeling) in MLM is a data-driven method used to predict the total long-term value a distributor brings to a network marketing organization — not just through personal sales, but also through their recruitment, team performance, and retention influence. Unlike traditional customer lifetime value models that focus solely on purchase behavior, MLM LTV modeling integrates multiple variables such as distributor engagement, downline activity, commission patterns, and churn probability. By applying predictive analytics and machine learning, companies can forecast which distributors will generate the most sustainable revenue, optimize incentive structures, and proactively manage retention to boost overall business growth.
Understanding lifetime value (LTV) for distributors — not just customers — is a strategic advantage for any direct-selling or multi-level organization. Modern distributor ecosystems are dual-role: distributors buy, sell, recruit, train and influence. That makes their lifetime value multi-dimensional (revenue, downline performance, referrals, retention), and it calls for richer predictive models than standard CLV formulas. Below is a practical, evidence-backed playbook for building advanced LTV models for distributor management, with market benchmarks, research signals and concrete features to implement now.
Traditional CLV focuses on purchases and retention. For distributors you must add their network effects (how many active recruits they produce), commission flow over time, training/activation rates, and influence metrics (referrals, social engagement). Treating distributors like ordinary customers systematically under-counts future value and misallocates coaching and incentives.
Recent literature and applied studies show specialized hierarchical or hybrid LTV frameworks outperform one-size-fits-all models — especially when users are organized in teams or nested groups (hierarchical modeling for LTV). This is increasingly confirmed by academic advances in 2024–2025.
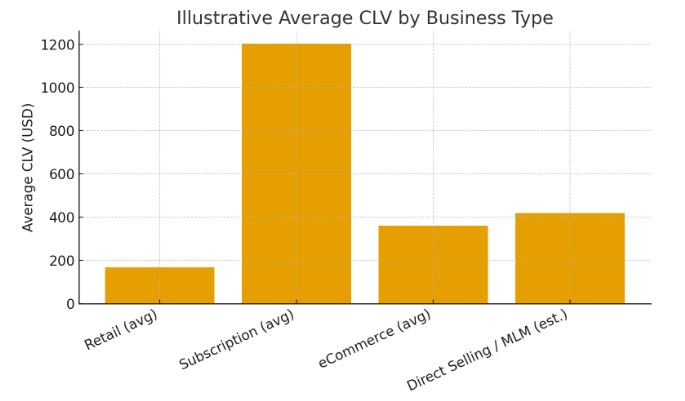
Average CLV varies by business model — retail averages near $168, while subscription businesses often see $1,200+. Use these ranges to sanity-check your distributor LTVs and segmentation.
Below are the features that consistently lift model accuracy in modern studies and enterprise applications:
Predictive value decays quickly if scoring lags. Implement a feature store and near-real-time recomputation for the most volatile features (recent orders, login, recruit activation). This enables timely interventions (e.g., automated coaching nudges the day after a weak month).
Use SHAP or similar explainability tools so managers understand drivers of a distributor’s LTV. This both builds trust and surfaces actionable levers (e.g., “increase training completion for this cohort”). Also ensure models respect privacy/regulatory constraints when using personal data.
Distributor LTV is richer than customer CLV: you must model the network, training, and uplift effects. Use hierarchical/survival approaches, enrich models with network/downline features, and move to near-real-time scoring. Benchmarks (CLV ranges, repeat rates, CLV:CAC) give sanity checks; uplift modeling and explainability make your investments measurable and defensible. Recent research and vendor trends in 2024–2025 confirm these techniques improve accuracy and business outcomes when applied carefully.
Lifetime Value (LTV) Modeling in distributor management estimates the total revenue and contribution a distributor generates throughout their active tenure. Unlike customer CLV, it includes downline performance, recruitment success, and retention impact.
LTV helps MLM companies identify high-potential distributors, optimize commissions, and allocate resources more effectively. Accurate LTV prediction reduces churn and increases ROI on incentive programs.
Predictive analytics uses machine learning to identify early behavioral signals of churn, sales decline, or recruitment slowdown—allowing proactive coaching, training, or incentive actions to retain top performers.
Key data sources include sales transactions, recruitment records, engagement metrics, training participation, commission flow, and team structure. Integrating these creates a holistic picture of distributor value.
Modern LTV modeling integrates real-time scoring, hierarchical models, and uplift-based predictions. These advancements help organizations personalize incentives and accurately forecast distributor performance.
MLM software platforms now embed AI-driven modules that calculate LTV dynamically—updating predictions as new transactions, recruits, or engagement data are added.