MLM software analytics refers to the process of collecting, tracking, and interpreting data from multi-level marketing platforms to drive smarter business decisions. Instead of relying only on basic tools like genealogy trees, commission tracking, or payout automation, advanced analytics digs deeper—measuring patterns such as distributor behavior, sales performance, and even cohort-level activation probability. In short, it transforms raw MLM data into actionable insights that can fuel growth, improve retention, and optimize every layer of the network.
In the competitive world of MLM businesses, data-driven decision-making can define the difference between exponential growth and stagnation. While most MLM software platforms already include features such as genealogy trees, commission tracking, and automated payouts, one advanced yet underutilized feature is Cohort-level Activation Probability Analysis.
This metric helps businesses understand how different groups of users behave over time, particularly their likelihood of activating, engaging, or making purchases. In this blog, we’ll explore:
A cohort refers to a group of users who share a common characteristic or join at the same time (e.g., distributors who joined in January 2025).
Activation Probability refers to the chance that these users will complete a desired action within a given timeframe — for example:
By tracking this metric at the cohort level, MLM businesses can identify which groups of recruits are most likely to become active contributors.
👉 Example:
This discrepancy signals differences in onboarding, promotions, or product appeal.
To compute cohort-level activation probability, your MLM software needs:
| Data Field | Description |
|---|---|
| User_ID | Unique distributor ID |
| Join_Date | Date user joined |
| Cohort_Month | Month/Year of joining |
| Activation_Flag | Whether user activated (1) or not (0) |
| Activation_Date | Date of first activation |
| Days_to_Activate | Number of days from join to activation |
Here’s a simplified version of the calculation in Python (Pandas + Matplotlib):
import pandas as pd
import matplotlib.pyplot as plt

# Sample Data
data = {
    'User_ID': [1,2,3,4,5,6,7,8,9,10],
    'Join_Date': [
        '2025-01-05','2025-01-12','2025-02-03','2025-02-07','2025-02-20',
        '2025-03-01','2025-03-10','2025-03-15','2025-03-25','2025-04-01'
    ],
    'Activation_Flag': [1,1,0,1,0,1,1,0,0,1],
    'Activation_Date': [
        '2025-01-10','2025-01-20',None,'2025-02-15',None,
        '2025-03-05','2025-03-20',None,None,'2025-04-07'
    ]
}

df = pd.DataFrame(data)
df['Join_Date'] = pd.to_datetime(df['Join_Date'])
df['Activation_Date'] = pd.to_datetime(df['Activation_Date'])

# Create Cohort by Join Month
df['Cohort_Month'] = df['Join_Date'].dt.to_period('M')

# Calculate Activation Probability
cohort_summary = df.groupby('Cohort_Month')['Activation_Flag'].agg(['count','sum'])
cohort_summary['Activation_Probability'] = cohort_summary['sum'] / cohort_summary['count']

print(cohort_summary)

# Plot Graph
cohort_summary['Activation_Probability'].plot(
    kind='bar', figsize=(8,5), title="Cohort Activation Probability"
)
plt.ylabel("Probability")
plt.show()
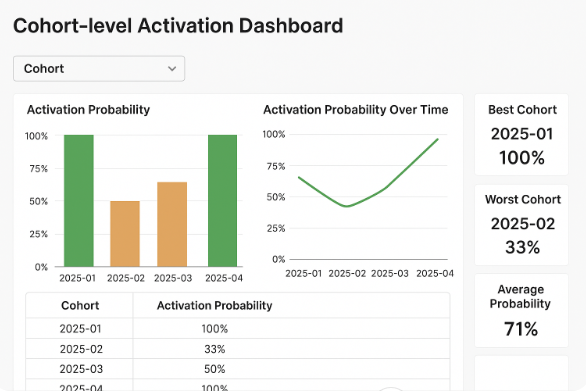
Output (Tabular):
| Cohort_Month | Users | Activated | Activation_Probability |
|---|---|---|---|
| 2025-01 | 2 | 2 | 100% |
| 2025-02 | 3 | 1 | 33% |
| 2025-03 | 4 | 2 | 50% |
| 2025-04 | 1 | 1 | 100% |
A user-friendly dashboard makes this analysis actionable. Here’s how you can structure it inside your MLM software:
Here’s your downloadable Cohort Analytics Dashboard (Excel file) for MLM software:
📊 Download Cohort_Activation_Analysis
This file includes:
Cohort-level activation probability is more than just a statistic — it’s a strategic growth lever for MLM businesses. By integrating this feature into your MLM software, you empower administrators to:
✅ Predict revenue more accurately.
✅ Improve distributor retention.
✅ Run smarter onboarding campaigns.
✅ Build stronger, data-backed leadership incentives.
With the provided Python code snippet and dashboard template idea, you can easily embed this analysis into your MLM software platform, making it not just a tool for tracking commissions — but a true analytics powerhouse for growth.
✦ Pro Tip: Pair cohort activation probability with LTV (Lifetime Value) analysis to uncover not just who activates, but who stays profitable long term.