In Multi-Level Marketing or MLM, a downline refers to the network of distributors or recruits that a person brings into the business, either directly or indirectly. It includes not just those they personally sponsor, but also the recruits of their team members, forming a layered hierarchy. This downline is the foundation of MLM earnings, as individuals earn commissions from their own sales as well as from the sales made by their downline.
To manage and understand this structure, MLM software uses tools like tree or genealogy mapping and spillover placement logic, which help companies and distributors track growth, performance, and compliance.
MLM is built upon layered recruitment structures, where individuals earn from both their direct sales and the sales generated by their “downline.” As networks expand, visualizing downlines becomes essential for understanding growth, performance tracking, and compliance with company placement rules. Two central pillars in MLM software design are tree/genealogy mapping and spillover placement logic. Both shape how distributors perceive their networks and how companies incentivize recruitment.
MLM organizations grow exponentially, with a single distributor potentially overseeing hundreds or thousands of downline members. Without clear visualization, this branching structure becomes unmanageable. Tree and genealogy mapping tools convert abstract network connections into tangible diagrams, offering clarity for both managers and recruits.
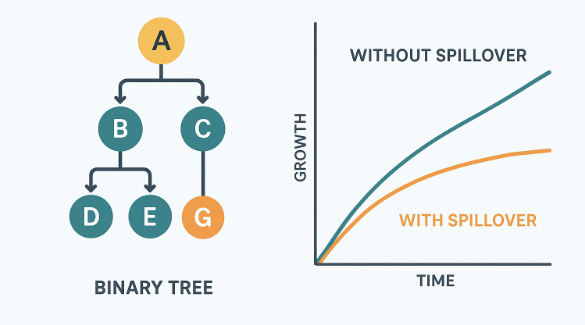
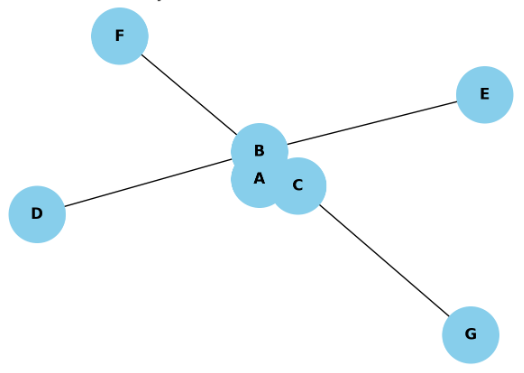
A binary tree visualization looks like this:
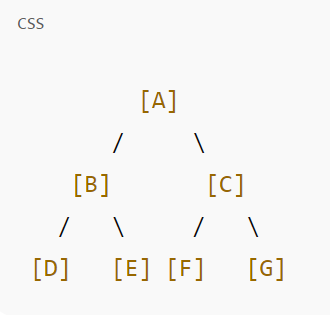
Each node represents a distributor; edges represent sponsor-recruit relationships. As the structure deepens, MLM dashboards allow zooming and filtering to analyze performance at micro or macro scales.
A simple adjacency list model (ParentID → ChildID) works for small downlines. But in large MLMs, graph databases like Neo4j offer advantages:
For example, a Neo4j query:
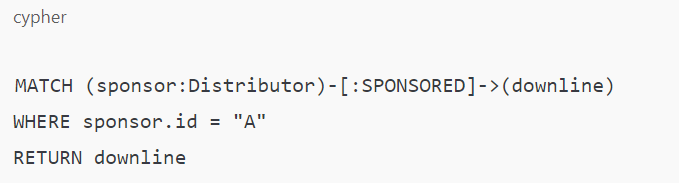
This retrieves A’s downline in milliseconds, even with millions of nodes.
In MLM binaries, each distributor has limited “slots.” Once filled, new recruits automatically spill over into their sponsor’s downline. This is a powerful marketing tool: recruits may benefit from uplines placing new members beneath them, even if they didn’t recruit them directly.
MLM platforms enforce strict placement algorithms to decide where a new recruit is positioned. Common rules include:
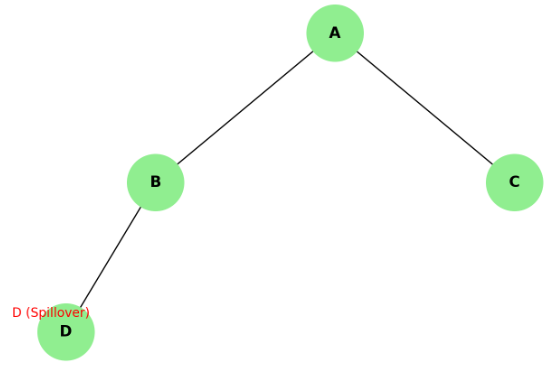
Example Spillover Tree (Binary with 2 Frontline Slots):
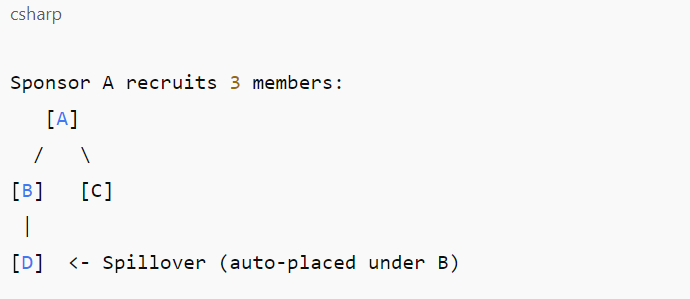
Here, A’s third recruit (D) is forced into B’s downline due to binary constraints. B gains “spillover,” which increases motivation but can distort performance comparisons.
Studies suggest that spillover:
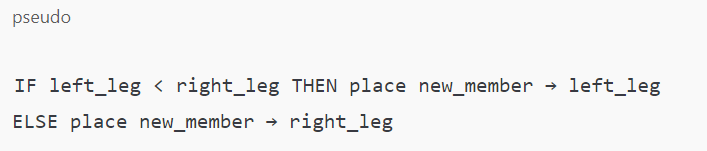
Using decision trees or rule-based engines, MLM software automates placement. For example:
A decision matrix can also capture placement rules:
| Condition | Action |
|---|---|
| Left leg < Right leg | Place recruit left |
| Right leg < Left leg | Place recruit right |
| Both equal | Place recruit left (default) |
This ensures balance while minimizing complaints of unfair placement.
A simple binary genealogy tree highlights depth vs. breadth growth. Useful for showing distributor saturation points.
Companies can generate heatmaps of active vs. inactive nodes, showing where spillover contributes to actual growth.
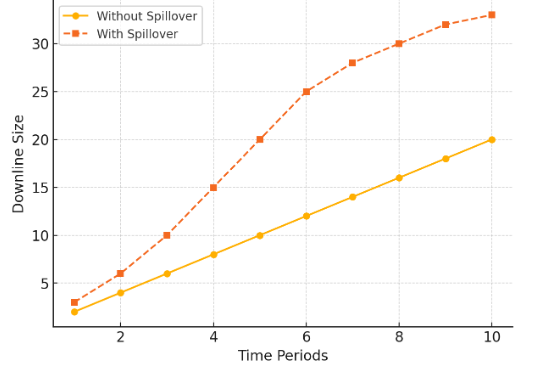
Graphing these two models shows the short-term boost but long-term instability caused by spillover dependency.
Q1. What is MLM downline visualization?
MLM downline visualization is a tool that displays the entire distributor network in a tree or genealogy map format. It helps leaders and team members easily understand the structure, hierarchy, and performance of their downline.
Q2. Why is genealogy mapping important in MLM software?
Genealogy mapping is important because it gives a clear view of distributor relationships, sponsor links, and team growth. It simplifies commission tracking, ensures plan compliance, and helps identify potential leaders or weak points in the network.
Q3. What are the benefits of downline visualization?
The key benefits include improved team monitoring, early detection of inactive members, better recruitment planning, and enhanced distributor motivation. It also adds transparency to MLM business operations.
Q4. What types of visualization are used for MLM genealogy mapping?
Common visualization formats include:
Binary trees for two-leg structures
Unilevel views for wide downlines
Matrix mapping for fixed-width hierarchies
Dashboard views for combined analytics
Q5. Can MLM downline visualization improve distributor retention?
Yes. Clear visualizations allow distributors to see their progress, which encourages motivation and long-term commitment. When members understand how their efforts impact overall growth, they are more likely to stay active.
Downline visualization in MLM is not just a cosmetic tool—it is central to understanding network health, distributor motivation, and compliance with compensation rules. Tree and genealogy mapping allow MLM firms to represent sprawling networks clearly, while spillover logic introduces both opportunities and risks.
For MLM stakeholders, striking a balance between transparent genealogy mapping and sustainable placement rules is key to long-term legitimacy and performance.
Know more @