In today’s highly competitive direct-selling and multi-level marketing (MLM) landscape, leaders of networks, distributors and platform providers all face the same challenge: how to turn data into better decisions, faster growth and sustained distributor engagement. A well-designed dashboard in your MLM software can be the difference between reactive management and proactive growth. In this article we’ll dive deep into the metrics that matter for MLM dashboards, explore design best-practices, include industry benchmarks and point to emerging trends that will shape MLM analytics going forward.
In this article we’ll explore what signals indicate your business has outgrown a generic CRM, delve into real-time market statistics, and map out the latest industry trends that make specialized MLM software the winning choice.
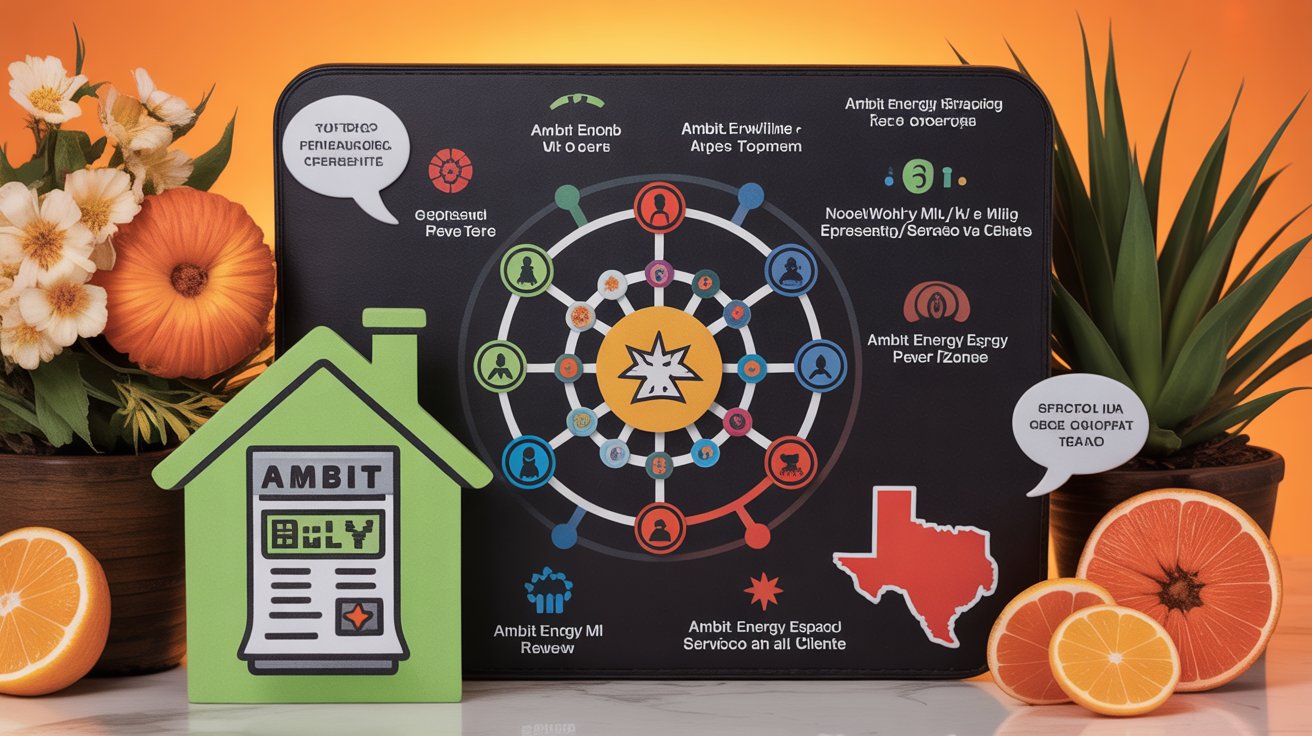
Before we jump into specific metrics, it’s useful to understand why a dashboard matters in the MLM context.
The global direct‐selling industry is projected to reach around $215.12 billion in 2025, growing at ~6.1% CAGR since 2022.
At the same time, more than 50% of new distributors and network businesses fail in the first year due to lack of insights and lack of network momentum.
A good dashboard converts raw data – e.g., enrolments, downline volume, product sales – into actionable insight: where the network is growing, where distributors are stalling, which legs are underperforming.
From a UX/design perspective, dashboards should be role specific (executive, regional manager, distributor), actionable (not just data but what to do) and visually clear (avoid clutter, focus on key KPIs).
In short: in MLM you’re dealing not just with transactions, but with a network of agents, tiers, compensation plans, churn risk, and team dynamics. The dashboard needs to reflect that complexity in a user-friendly way.
Here are the essential metric categories and specific KPIs that any robust MLM dashboard should display. I’ve grouped them by category for clarity.
📌 Why these matter: In MLM, growth isn’t just about product sales — it’s about network expansion. If recruitment stalls or churn rises, the downstream sales volume suffers.
Because dashboards are more useful when you can compare metrics against benchmarks, here are some relevant points:
To give a concrete illustration: if you know your average DSV growth rate is 15% month over month, your dashboard should alert when any major leg falls below, say, 8%. This kind of benchmark (your own historical average) becomes actionable.
Because the value of the dashboard depends as much on how it’s designed as what it shows, here are key design principles:
As we move into 2025 and beyond, several trends are shaping how MLM dashboards and analytics evolve.
Here’s a recommended layout for a high-level MLM executive dashboard — think of it as your “launchpad”.
| Section | Metrics to show | Visualization suggestion |
|---|---|---|
| Network Health | New sign-ups (this month & growth %), Active distributor rate, Churn rate | Scorecards + small bar chart |
| Sales Performance | Total Sales Volume (TSV) this month, Growth rate MoM, Top 3 product lines | Big number + trend line + pie chart |
| Regional Performance | Sales volume by region top 5, Leg imbalance % per region | Horizontal bar chart + heat map |
| Distributor Engagement | % of distributors sponsoring someone this month, Training completion %, Bonus uptake rate | Pie chart + stacked bar chart |
| Alerts & Risks | List of “legs” or distributors below performance threshold, Predicted churn risk | Table + traffic-light indicators |
In the back-office you can offer drill-downs: clicking a region shows distributor-level metrics, clicking a distributor shows their downline tree and their legs’ recent growth.
If you’re running or building an MLM software platform, investing in a high-quality dashboard is not optional — it’s a competitive differentiator.
Choose metrics that reflect both sales and network dynamics. One without the other means you’re ignoring the heart of MLM.
Set benchmarks early (based on historical data) and use the dashboard to raise red flags proactively (e.g., leg falls below 70% of average).
Make dashboards role-specific: give executives a quick overview; give team leaders deeper insights; give distributors the motivators and next-step actions.
Stay ahead of trends: incorporate predictive analytics, mobile push, real-time refreshes, and visualization designs that engage rather than overwhelm.
In the modern MLM ecosystem, success increasingly depends not just on recruiting and sales, but on visibility, insight and responsiveness. A thoughtfully designed dashboard turns raw network data into actionable intelligence — showing where your network is thriving, where it’s stalling, and where you must intervene. By focusing on the right metrics, applying design best practices and embracing emerging analytical trends, you’ll equip your organisation (and your distributors) with the tools to grow smarter, faster and more sustainably.
What is an MLM dashboard?
An MLM dashboard is a centralized interface that displays real-time analytics on sales, recruitment, and distributor performance for multi-level marketing businesses.
Why is dashboard design important in MLM software?
Good dashboard design ensures clarity, faster decision-making, and higher engagement among distributors.
What are the top metrics to track in an MLM dashboard?
Track active distributors, downline growth, churn rate, total sales volume, and bonus payouts.
How does dashboard design impact distributor motivation?
A visually engaging dashboard with leaderboards and progress trackers boosts motivation through transparency and gamification.
What’s the ideal layout for an MLM dashboard?
Use modular cards for recruitment, earnings, sales performance, and churn alerts with clean charts and KPIs.
Can an MLM dashboard help reduce churn?
Yes. Predictive analytics can flag inactive distributors early, helping leaders take retention actions.
Which MLM compensation plan suits a binary dashboard setup?
Binary plans benefit from dashboards that visualize left-right leg volumes, balance ratios, and team productivity.
Is AI integration useful in MLM dashboards?
Absolutely. AI identifies performance patterns, predicts churn, and recommends actions to improve downline health.
How can regional managers use MLM dashboards?
They can compare region-wise growth, monitor leg imbalance, and identify underperforming teams.
What technologies are best for building MLM dashboards?
Modern MLM platforms use React, Node.js, and BI tools like Power BI or Looker for data visualization.
👉 Try the official MLM Software Demo for Your MLM Business
and experience what MLM Software looks like when it’s powered by the best.
💌 Or, check out our blog
to compare top direct-selling companies, get insider reviews, and learn how to grow your income ethically in the wellness niche.